Climate change and mycotoxin prevalence
By Paula Kovalsky*
The occurrence of mycotoxins is a worldwide phenomenon that affects all kinds of commodities. The conditions under which these toxic substances are produced depend highly on two main factors: water availability and temperature that affect the life cycle of mycotoxigenic fungi. It seems that we are facing shifts in mycotoxin patterns as the world is experiencing climate changes. This much-discussed topic does not only imply temperature increase, but also increases in CO2 levels and high variability in weather conditions, including changes in precipitation patterns and frequent storms.
Climate change and its impact on fungal profile
The Intergovernmental Panel on Climate Change (IPCC) report of 2014 shows different global warming projections, with a prediction that in the year 2100, global temperatures may increase by up to 4.8°C. Climate change is expected to affect agriculture not only due to the physiological response of crops to temperature increase, changes in precipitation patterns and atmospheric CO2 concentrations, but also due to other factors. On the one hand, changes in temperature and water availability may influence the efficacy of fungicide and pesticide pre-harvest applications. On the other hand, climate change may alter the geographical distribution or the life-cycle of insects that promote fungal infections of crops. We are also observing how some fungal species are being displaced by other more virulent or aggressive fungi.
According to the 2008 FAO report on climate change and its implications on food safety, Fusarium culmorum is being replaced by F. graminearum, the most virulent plant pathogen. In North America, there are changes being observed in Fusarium populations to more toxigenic Fusarium isolates. Novel strains are also being discovered that form unexpected toxins, which may be the result of a changing environment. For instance in Minnesota, a novel Fusarium isolate called the “Northland population” has emerged, which does not produce the protein synthesis inhibiting trichothecenes deoxynivalenol or nivalenol.
It is assumed that the highest mycotoxin risks will be observed not only in countries with tropical climates but also in countries with temperate climates, such as parts of Europe and the United States of America, if temperature begins to rise and favors aflatoxin B1 (AfB1) production. For instance, during the hot and dry episodes in northern Italy in 2003, Aspergillus flavus was able to actively colonize the ripening maize, a key crop, by outcompeting the more common Fusarium species. This led to an uncommon increase in Afla B1 contamination in Europe.
Mycotoxin occurrence in 2013
Since 2004, BIOMIN, a pioneer in mycotoxin risk management, has been conducting a yearly mycotoxin survey which provides an assessment of the risks caused by aflatoxins (Afla), zearlenone (ZEN), deoxynivalenol (DON), fumonisins (FUM) and ochratoxin A (OTA) in agricultural commodities around the globe (Figure 1).
Figure 1: Prevalence of mycotoxins in different geographic regions according to the percentage of positive samples (> limits of quantification, LoQ)
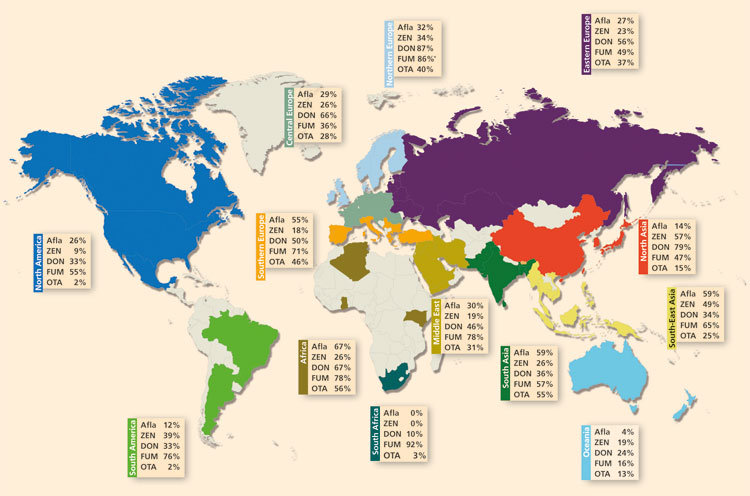
The latest results show that once again, DON and FUM threaten over half of all samples tested worldwide (n = 4 218). Over one-third of all tested samples were contaminated with ZEN and compared to the previous year, the number of samples positive for Afla increased by 5 percentage points to a total of 30%. In 2013, 81% of all samples contained at least one mycotoxin and in 45% of the samples more than one mycotoxin were found. Corn was found to contain the highest concentrations of singly occurring Afla and ZEN. Corn dried distillers grains with solubles (DDGS) contained the highest concentration of FUM.
Table 1 gives an overview of the occurrence of mycotoxins in different regions. Asia remains the region with highest maximum values for most of the tested mycotoxins (Afla, ZEN, DON and FUM). The highest maximum concentration of all mycotoxins was 29 267 ppb DON in a Chinese barley sample. The highest average Afla concentration was observed in European samples. The incidence of OTA in Europe was lower compared to 2012; however, the average values are about three times higher (16 ppb). In North America, FUM remains the most common mycotoxin, although the incidence was 23% lower compared with the previous year. South American samples have the highest global average of ZEN at 221 ppb, a concentration that significantly exceeds the EU guidance values for complementary and complete feeding stuffs for piglets and gilts due to their high sensitivity to this estrogenic compound. In the Middle East, over 50% of all samples showed a co-contamination with more than one mycotoxin and almost 80% tested positive for FUM. The results for African samples show a lower occurrence of mycotoxin in 2013 compared with the previous year. Despite the high prevalence of FUM in Africa (86%), the average concentration was lowest worldwide (778 ppb). However, single samples can contain relatively high concentrations of over 4 500 ppb.
The mycotoxin survey gives a clear picture of why these toxic substances are a matter of concern in agricultural commodities. Multi-mycotoxin occurrences continue to be a global threat and with changing climate conditions, shifts in mycotoxin patterns are bound to occur. Constant monitoring and continuous research on the prevention and mitigation of mycotoxin contamination are therefore necessary. The first step towards preventing the negative effects of these harmful substances is the implementation of good agricultural practices and proper storage conditions.
Further reading
- http://www.biomin.net/at/science-and-solutions-magazine/#.U2M1Jvl_tVI
- http://mycotoxinsinfo.blogspot.co.at
- Rodrigues I., Naehrer K. A three-year survey on the worldwide occurrence of mycotoxins in feedstuffs and feed. Toxins. 2012;4:663–675. doi: 10.3390/toxins4090663.
- Streit E., Schwab C., Sulyok M., Naehrer K., Krska R., Schatzmayr G.
- Multi-Mycotoxin Screening Reveals the Occurrence of 139 Different Secondary Metabolites in Feed and Feed Ingredients. Toxins. 2013;5 (3): 504–523. doi: 10.3390/toxins5030504
- Rodrigues I., Naehrer K. Prevalence of mycotoxins in feedstuffs and feed surveyed worldwide in 2009 and 2010.Phytopathologia Mediterranea. 2012; 51 (1): 175−192.
- Streit E., Schatzmayr G., Tassis P., Tzika E., Marin D., Taranu I., Tabuc C., Nicolau A., Aprodu I., Puel O., Oswald I. P. Current situation of mycotoxin contamination and co-occurence in animal feed-focus on Europe. Toxins. 2012;4: 788–809.
- Borutova R., Acosta Y., Nährer K., Berthiller F. Co-occurrence and statistical correlations between mycotoxins in feedstuffs collected in the Asia–Oceania in 2010. Animal Feed Science and Technology. 2012;178 (3): 190-197.
Table 1: Occurrence of mycotoxins in different regions of the world.
Table 1a - North Asia (China, Taiwan, Korea, Japan)
|
|
Afla |
ZEN |
DON |
FUM |
OTA |
|
Number of tests |
947 |
983 |
1,001 |
909 |
920 |
|
% of samples above detection limits |
14 |
57 |
79 |
47 |
16 |
|
Average of positive (µg/kg) |
74 |
179 |
867 |
1,476 |
5 |
|
Maximum (µg/kg) |
1 563 |
5 324 |
29 267 |
15 576 |
50 |
Table 1b - South East Asia (Malaysia, Philippines, Thailand, Vietnam, Indonesia, Myanmar, Singapore)
|
|
Afla |
ZEN |
DON |
FUM |
OTA |
|
Number of tests |
480 |
480 |
480 |
480 |
480 |
|
% of samples above detection limits |
59 |
49 |
34 |
65 |
25 |
|
Average of positive (µg/kg) |
45 |
67 |
318 |
1 080 |
5 |
|
Maximum (µg/kg) |
1 101 |
928 |
7 030 |
26 828 |
226 |
Table 1c - South Asia (India, Pakistan, Bangladesh, Sri Lanka)
|
|
Afla |
ZEN |
DON |
FUM |
OTA |
|
Number of tests |
58 |
58 |
58 |
58 |
58 |
|
% of samples above detection limits |
59 |
26 |
36 |
57 |
55 |
|
Average of positive (µg/kg) |
51 |
64 |
327 |
940 |
17 |
|
Maximum (µg/kg) |
525 |
295 |
1 960 |
9 562 |
260 |
Table 1d - Oceania (Australia, New Zealand)
|
|
Afla |
ZEN |
DON |
FUM |
OTA |
|
Number of tests |
135 |
135 |
135 |
135 |
135 |
|
% of samples above detection limits |
4 |
19 |
24 |
16 |
13 |
|
Average of positive (µg/kg) |
11 |
267 |
353 |
1 059 |
4 |
|
Maximum (µg/kg) |
45 |
1 721 |
2 979 |
14 301 |
20 |
Table 1e - North America (USA,Canada)
|
|
Afla |
ZEN |
DON |
FUM |
OTA |
|
Number of tests |
160 |
139 |
155 |
161 |
85 |
|
% of samples above detection limits |
26 |
9 |
33 |
55 |
2 |
|
Average of positive (µg/kg) |
20 |
112 |
1 303 |
2 015 |
2 |
|
Maximum (µg/kg) |
394 |
429 |
11 600 |
23 180 |
3 |
Table 1f - South America (Brazil,Argentina)
|
|
Afla |
ZEN |
DON |
FUM |
OTA |
|
Number of tests |
234 |
140 |
123 |
254 |
47 |
|
% of samples above detection limits |
12 |
39 |
33 |
76 |
2 |
|
Average of positive (µg/kg) |
4 |
221 |
333 |
2 422 |
1 |
|
Maximum (µg/kg) |
21 |
4 497 |
1 651 |
15 140 |
2 |
Table 1g - Middle East (Israel, Jordan, Iraq)
|
|
Afla |
ZEN |
DON |
FUM |
OTA |
|
Number of tests |
46 |
54 |
57 |
50 |
52 |
|
% of samples above detection limits |
30 |
19 |
46 |
78 |
31 |
|
Average of positive (µg/kg) |
5 |
16 |
206 |
1 310 |
2 |
|
Maximum (µg/kg) |
15 |
25 |
843 |
3 487 |
8 |
Table 1h – Africa (Algeria, Kenya,Ghana)
|
|
Afla |
ZEN |
DON |
FUM |
OTA |
|
Number of tests |
27 |
27 |
27 |
27 |
27 |
|
% of samples above detection limits |
67 |
26 |
67 |
78 |
56 |
|
Average of positive (µg/kg) |
16 |
56 |
335 |
1 483 |
2 |
|
Maximum (µg/kg) |
200 |
154 |
1 368 |
4 593 |
15 |
Table 1i - South Africa
|
|
Afla |
ZEN |
DON |
FUM |
OTA |
|
Number of tests |
39 |
39 |
39 |
39 |
39 |
|
% of samples above detection limits |
0 |
0 |
10 |
92 |
3 |
|
Average of positive (µg/kg) |
- |
- |
212 |
367 |
1 |
|
Maximum (µg/kg) |
0 |
0 |
389 |
1 497 |
1 |
Table 1j - Northern Europe (Norway, Sweden, Finland,Denmark)
|
|
Afla |
ZEN |
DON |
FUM |
OTA |
|
Number of tests |
31 |
125 |
127 |
28 |
25 |
|
% of samples above detection limits |
32 |
34 |
87 |
86 |
40 |
|
Average of positive (µg/kg) |
7 |
84 |
1 544 |
751 |
6 |
|
Maximum (µg/kg) |
22 |
1 246 |
18 971 |
2 256 |
55 |
Table 1k - Central Europe (Austria, Belgium, Czech Republic, Germany, France, Hungary, Romania, Slovakia, Slovenia, Poland,the Netherlands)
|
|
Afla |
ZEN |
DON |
FUM |
OTA |
|
Number of tests |
357 |
930 |
1 331 |
290 |
313 |
|
% of samples above detection limits |
29 |
26 |
66 |
36 |
28 |
|
Average of positive (µg/kg) |
9 |
84 |
789 |
406 |
11 |
|
Maximum (µg/kg) |
101 |
3 950 |
12 000 |
3 511 |
238 |
Table 1l - Southern Europe (Italy, Greece, Portugal, Spain, Croatia, Bulgaria,Turkey)
|
|
Afla |
ZEN |
DON |
FUM |
OTA |
|
Number of tests |
286 |
306 |
342 |
231 |
241 |
|
% of samples above detection limits |
55 |
18 |
50 |
71 |
46 |
|
Average of positive (µg/kg) |
6 |
86 |
411 |
1 563 |
23 |
|
Maximum (µg/kg) |
104 |
1 321 |
9 903 |
20 260 |
595 |
Table 1m - Eastern Europe (Russia,Ukraine)
|
|
Afla |
ZEN |
DON |
FUM |
OTA |
|
Number of tests |
37 |
52 |
54 |
35 |
35 |
|
% of samples above detection limits |
27 |
23 |
56 |
49 |
37 |
|
Average of positive (µg/kg) |
4 |
205 |
552 |
1 219 |
3 |
|
Maximum (µg/kg) |
7 |
670 |
3 166 |
4 750 |
9 |
* Product Manager Mycofix®, BIOMIN Holding GmbH, 6 May 2014