Key Performance Indicators: a vital diagnostic tool to assess performance of tropical dairy farms
By Dr John Moran, Profitable Dairy Systems, Kyabram, Victoria, Australia
The concept of Key Performance Indicators (KPIs) is not new. However it is when applied to quantifying the performance of farmers in the developing tropics. Expressed simply, KPIs are diagnostic tools allowing farmers to improve their farm productivity and hence their financial performance. Farmers can use them to identify weaknesses in, as well as set specific targets for, their farms. They are more likely to want to improve their systems if they know by how much they are less productive compared to others of similar herd sizes.
Each KPI provides a valuable insight into the efficiency of utilisation of farm resources and management skills of individual farmers. However it is important to prioritise them based on;
- Their relevance to the farmer’s current stage of farm development, such as whether his herd size has stabilised
- The farmer’s ability to interpret the data and use it in future decision making
- The ease and accuracy of collecting the necessary raw data to determine each KPI.
Although many dairy farmers intuitively think about farm costs and returns, greater use could be made of formats allowing them to be more aware of the relative importance of all their financial inputs in terms of cost of production (COP) per kg of milk produced on the farm.
Knowing their cost of production allows dairy farmers to determine their profit margins and this is critical to operating a sustainable dairy enterprise. Farmers must do more and better planning if they are to achieve greater profits. Profits are not something they end up with at the end of the year. Rather, they are something for which farmers must plan.
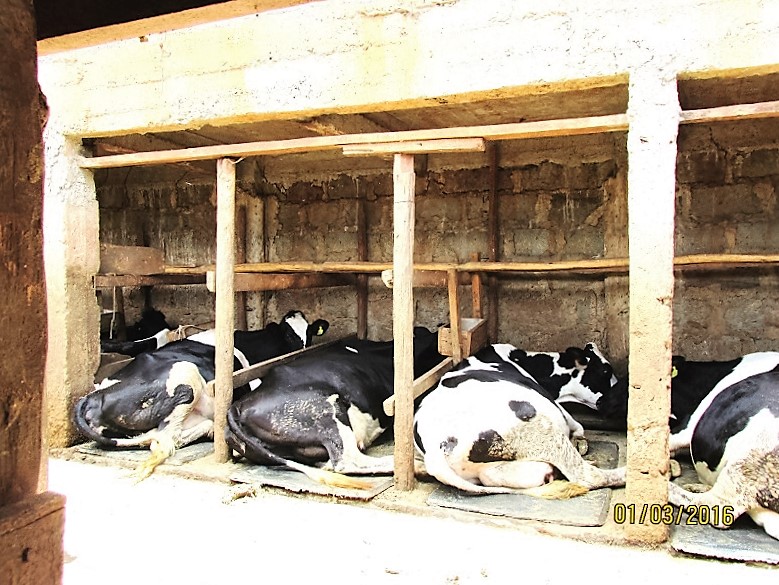
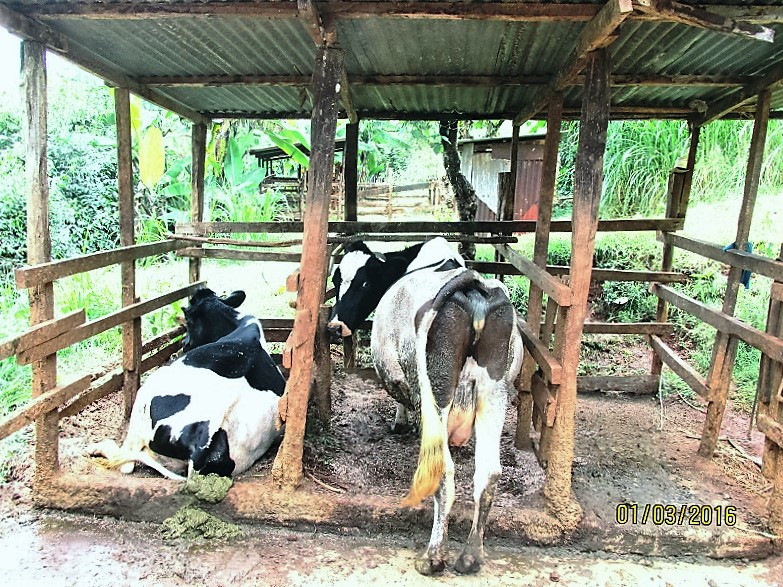
Even on smallholder farms, there is a wide range in milk production per cow. These pictures were taken in Kenya on two free stall adjoining farms, highlighting the results of their variation of feeding management and cow comfort. (a) These Friesian cows were averaging 14.4 L milk/cow/day with each cow provided with a thick sponge rubber mat on which to lie. (b) These Friesian cows were only averaging 5 L milk/cow/day with no soft bedding. Note the difference in cow size and body condition between the two farms. Photo credit: John Moran
Table 1 presents a range of KPIs to help farmers diagnose the strengths and weaknesses in their dairy enterprise. Farmers should use these indicators initially to identify these weaknesses in, rather than set targets for, their farm. Farmers are more likely to try to improve their systems if they know they are less productive, and by how much, compared to others. Such an approach should encourage farmers to look more critically at their cost structures. Expressed simply, this is a diagnostic tool to help identify production weaknesses adversely affecting productivity and financial performance.
The following ten series of questions should be asked on any farm, big or small. Because up to 70% of farm costs are feed related, the first six questions are directly related to feeding management. Even though the remaining four are more related to overall herd management, they are still very much feed-dependent. For some of the questions such as stocking capacity, specific indicators relevant to particular farming systems can be developed. However, for others, there is no single indicator that farmers can work towards because the most correct answer is the higher the better for some (such as on farm forage production or forage quality) or the lower the better for others (such as total feed costs or calf mortality and heifer wastage rates). These indicators should be presented as ranges rather than a single value emphasising the fact that they are only guidelines. These ten key measures or symptoms of poor farm performance for which diagnoses should be considered are presented in Table 1.
Table 1. Ten key measures of smallholder dairy farm performance
|
Measure |
Questions to ask |
| Feeding management | |
| 1. Stocking capacity | Is the farm carrying too many stock for the available forage supplies? |
| 2. On-farm forage production | How much of the farm’s annual forage requirements must be purchased? |
| 3. Forage quality | Is the forage being harvested or purchased at its optimal quality for milking cows? |
| 4. Concentrate feeding programme | What is the quality of the concentrates being fed and how much is allocated per milking cow? |
| 5. Total feed costs | Are the forages and concentrates costing too much per unit of feed energy or protein? |
| 6. Milk income minus feed costs | How does this compare with those of other farmers with better feeding management? |
|
Herd management |
|
| 7. Percent productive cows | What is the percent of adult cows actually milking? What is the proportion of milking cows in the entire dairy herd, expressed as a percentage? |
| 8. Pattern of milk production | What is the peak milk yield of the herd and what is its lactation persistency (rate of decline from peak milk yield)? |
| 9. Reproductive performance | How many days after calving do cows cycle? What is the submission rate and the conception rate to first insemination? What is the inter-calving interval? |
| 10. Heifer management | What is the pre weaning calf mortality and the wastage rate of heifers from birth to second lactation? What is their age and live weight at first calving? |
Actual values for these KPIs have been discussed in detail by Moran (2009). They could be summarised as follows:
| 1. Stocking capacity: | 8 to 12 adult cows per ha forage production |
| 2. On-farm forage production: | The more the better |
| 3. Forage quality: | 9.5 to 10.0 MJ/kg DM of metabolisable energy (ME) |
| 12 to 14% protein | |
| 4. Concentrate quality: | 11 to 12 MJ/kg DM of ME |
| 14 to 18% protein | |
| 5. Total feed costs: | Not too high, below 60% total cost of milk production |
| 6. Milk income less feed costs: | The higher the better |
| 7. Percent productive cows: | Of all the adult cows in the herd (milking and dry), 60 to 74% |
| 40 to 48% of milking cows in the total dairy herd | |
| 8. Pattern of milk production: | High peak milk yield, 15 to 20 kg/cow/day (depending on genetic potential of the animal) |
| Low rate of decline from peak, >8% per month from peak | |
| 9. Reproductive performance: | 55 to 60% pregnant within 100 days of calving down |
| 13 to 15% still non-pregnant within 200 days of calving down | |
| 65 to 70% “80-day submission rate” (that is cows which were inseminated within 80 days of calving down) | |
| 50 to 60 day voluntary waiting period prior to insemination | |
| 45 to 50% conception to first insemination | |
| 1.8 to 2.0 inseminations per conception | |
| 12 to 14 months inter-calving interval | |
| 10. Heifer management: | 4 to 6% calf mortality to weaning |
| 20 to 25% “wastage rate” (stock deaths between when they were born and their second calving) | |
| 250 to 300 kg live weight at mating | |
| 400 to 450 kg live weight at first calving | |
| 26 to 28 months age at first calving |
Ease of collecting raw data
Each and every KPI presented in Table 1 can provide a valuable insight into the utilisation of farm resources and the management skills of individual dairy farmers, large or small.
The ability of dairy farmers to collect the raw data would vary greatly with their management skills, level of education, support from service providers and most importantly, their motivation to want to use the particular KPIs in their farm decision making.
Some of the easiest to collect are the raw data to calculate the proportion of productive cows (KPI-7) as most smallholder farmers know the number of milking cows, dry cows, heifers and calves in their herd. Another “easy to collect” data set is the stocking capacity (KPI-1), as most farmers know their forage production area.
It is not difficult to collect raw data on pattern of milk production (KPI-8) as many farmers record daily milk yields from individual cows. The level of concentrate feeding (KPI-4) is another data set readily available while many farmers could estimate their daily forage feeding programme (as a guide to KPI 2). Likewise, some of the reproductive (KPI-9) and heifer data (KPI-10) can be easily calculated from raw data on dates of inseminations, calvings and ages at first calving, while a chest girth tape can easily provide estimates of live weights of different classes of stock. Inter-calving interval is also relatively easily calculated and is a good general measure of herd health, nutrition and reproductive performance.
The above diagnoses require the calculation of many KPIs to allow a value judgement to be made on business performance. Many of these indicators are simply common ratios or proportions, assessing some level of output in relation to some level of input. Others measure success simply with numbers or amounts, such as target forage quality or heifer live weight. Although they are valuable guides, there is no all-encompassing or perfect indicator of business success. All indicators must be viewed within the whole business, with each one contributing only a part.
It is possible to achieve high performance in a KPI which does not translate into business financial success. If a farmer whose farm has very poor quality soils and may not be able to grow as good a quality forage as he can purchase, at a good price, close by, it would be more profitable to let someone else grow the bulk of forages he requires.
Low performance measures in some key factors, well below these KPIs, often lead to high performance measures in other key factors which can produce a false sense of security about the ability to achieve some of the production targets. One example is low peak milk yield and short inter-calving intervals in cows of low genetic merit. Because such cows are not ‘genetically programmed’ to use their body reserves to supplement the limited intakes of feed nutrients during early lactation, their live weight will hardly change and they may cycle soon after calving. If the farmer plans to improve the genetic merit of the cows by using high grade semen without improving their feeding management during early lactation, then peak milk yields may not greatly improve while herd fertility is likely to drastically fall.
The list on Table 1 is an initial attempt to prioritise these indicators to develop a structured approach to addressing poor farm profitability. It must be stressed that no single KPI should be used in isolation to assess farm performance and hence profitability, as each one is the end result of interactions between many farm inputs. It is important to ensure there is a balance between their utilisation so that one production target is not achieved at the expense of others within the farming system.
The above are just a few of the many KPIs available to assess a farm’s performance. In our latest book, (Moran and Chamberlain 2016), we have listed a total of 174 KPI’s for tropical dairy farms.
References
Moran, J. (2009). Key performance indicators to diagnose poor farm performance and profitability of smallholder dairy farmers in Asia. Asian Australasian Journal of Animal Science 22 (12), 1709-1717. http://dx.doi.org/10.5713/ajas.2009.90201
Moran, J. and Chamberlain, P (2016). Blue Prints for tropical dairy farming. CSIRO Publications, Melbourne (in press).