NIRS for feed and soil analysis in developing countries
By Pierre Dardenne (Walloon Agricultural Research Centre) and Paulo Salgado (CIRAD)
NIRS theory in a few words
Spectroscopy refers to the science dealing with the interactions between matter and light. In the infrared region (780 – 10 000 nanometers – Figure 1), the light hitting organic matter can be absorbed by the molecular vibrations at specific wavelengths depending on the chemical bonds (OH, CH, NH, etc.).
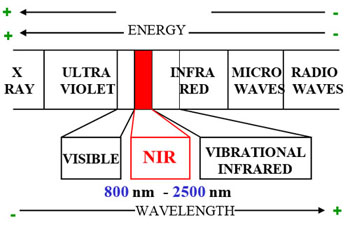
Figure 1. The electromagnetic spectrum
In the Mid-Infrared range (MIR) (2 500 – 10 000 nm), one can observe the fundamental absorptions bands and this region is mainly used for molecule identification and also for quantification, especially for liquids (e.g. milk). In the Near-Infrared range (NIR) (780 – 2 500 nm), one can observe the combinations and overtones of the fundamental bands of the MIR. The absorption bands in the NIR region are much weaker that the fundamental bands in the MIR. Due to this fact, NIRS can measure a much bigger quantity of sample matter. In the MIR region, milk is analyzed with a transmission cell of 30 µm whereas in near NIR region (850 – 1 050 nm) photons can get through 2 cm of meat or cheese. The spectra in NIR region are more difficult to interpret than the ones in the MIR region due to the overlapping bands. In the NIR region, a single band is not sufficient to differentiate samples for a given constituent. The calibration must be multivariate. A calibration is an empirical link (an equation) between analytical results obtained by the traditional methods (called “wet” chemistry) and the spectra acquired on a representative set of samples of a given product. The statistical techniques used to create these equations are a part of the science called “chemometrics”. There are many methods to calculate these prediction equations but one can sum up them by saying that a model of prediction is a vector of coefficients that amplifies relevant regions of the spectrum to minimize the residual errors between NIR and the reference one. The goal is of course to replace the costly, tedious and time consuming reference methods by NIR spectroscopy. The acquisition of a spectrum from a given sample takes less than two minutes and the calibration equations applied to the spectrum can determine multiple parameters simultaneously.
The NIR instruments
The use of NIRS started in the 60s from the research work of the father of the technology, Dr. Karl Norris, from USDA, who published the first results on fruit maturity. The first commercial instruments appeared in the market in the beginning of the 80s, mainly to measure protein and moisture in cereals. Dr. Phil Williams, from the Canadian Grain Commission, was pioneer in this field who replaced the polluting nitrogen method (Kjeldahl) by NIR instruments. Nowadays, one can count more than 60 companies building NIR equipments and there are uncountable number of industries and laboratories using NIRS in fields such as agriculture, agroindustry, forestry, environment, medical, pharmaceutical, chemical, petrochemical, among others. The construction of an instrument is quite simple (Figure 2).

Figure 2. Schematic representation of a dispersive monochromator
There are four main parts in an instrument: a light source, a system to generate the “monochromatic” beams, a sample holder and a detector. The concave mirror (grating) moves to generate light at the different wavelengths. There are other ways to generate the light at given wavelengths (filters, interferometer, etc.). Likewise there are different kinds of detectors (PbS, PbSe, InSb, HgCdTe, Ge, InGaAs, etc.). A detector is a semiconductor whose resistance decreases with the incoming energy. A computer is linked to acquire the signal of the detector and to save the numerical absorbances of the spectra. A NIR instrument is very easy to operate and after a short training anyone is able to scan samples. The essential requirement is a stable electric power supply
Sample presentation
As MIRS is very powerful for liquids, NIRS is more dedicated for slurries and powders with larger sample quantity (>10 gram). Historically the sample presentation requires working on dried and ground products, but more and more applications have started appearing on intact fresh products (cereals, forages, fruits, meat, etc.). One must verify that the spectrum which is recorded is representative of the sample and depending on the physical form of the product, the samples must be dried, ground and homogenized. A fresh coarse forage must be dried, ground and well mixed whereas wheat flour can be measured as such. Depending on the sample holder, a NIR instrument can scan samples from micrograms (NIR microscopes) to several kilos (NIR on-line).
Calibration process
To be able to use NIRS in routine mode, the instrument must be calibrated following the steps given below:
- Define the product and the area (a village, a province, a country, etc.);
- Collect samples with the most diverse origin (in term of soils, climate, growing stages, fertilizers, etc.) and preserve the samples for future analyses;
- Prepare and homogenize the samples;
- Collect the spectra of the samples (say 500 samples);
- Based on the spectral variation, select 50 representative samples which cover the total variance;
- Send the selected samples for wet chemistry analysis;
- Merge these analyses with the spectra and compute a model;
- Reselect few samples (20 from another location or growing season) and perform the wet chemistry;
-
Monitor the results to be sure that the model performance is as per expectation:
- a) If it is satisfactory, go for routine analyses using the developed equations;
- b) If it is unsatisfactory, repeat steps 6 to 9 until it works satisfactorily.
The calibration process is a real investment and could cost quite a lot, mainly due to the high cost of wet chemistry analyses. An alternative way is to find or buy models which have been developed for many years by specialized companies or research centers. Buying models is a faster process to start routine analyses than developing specific and local equations, but monitoring the performance remains essential for accurate and useable analyses and ‘local’ samples must be selected using steps 5 to 9 described above. If the equations did not performed well, the user should consider sending some spectra and wet chemistry values to the vendor and they will recalibrate and provide new models after integration of the ‘local’ samples.
What can measure NIRS?
In the field of animal production, the main parameters of interest for a feedstuff are dry matter, protein, fat, starch, fiber and ash contents. These parameters can be determined with high accuracy by using NIRS. Depending of the goal, other analyses can also be conducted for examples: fatty acids, sugar profile, amino acids, vitamins, polyphenols, tannins, anti-nutritional factors, organic matter digestibility, dry matter intake, BMP (bio methane potential), etc. In soil samples, the determination of total organic carbon, nitrogen, and clay contents and cation exchange capacity, among many others can be conducted.
Theoretically, NIR can be calibrated for any parameter or phenomenon where organic matter is involved. The unique limitation is the parameter concentration. Because there is no component separation (like chromatography), analytes which are in low concentrations (below 0.1% dry matter) can be masked in the spectra; and if a calibration works anyway for low concentrations, it is likely due to internal correlations inside the product matrix. It means a major component can be correlated with a minor component and then both models will work well but predicting only the major component. If the minor component is changed by artificial spiking for instance, it will not be seen by the model and the determinations could be erroneous.
Feed analysis applications
The spatial and temporal variability in the quality of feed resources (pastures, forages, by-products, etc.) in the tropics is quite high. However, in most tropical countries accurate and fast analysis of feed resources is constrained due to limited access to laboratories and their poor analytical capacity. More precise control of animal feeding involves the use of tools and management methods that are accessible, low cost, easy to use, quick to implement and, if possible, portable.
Nowadays the use of NIRS portable devices allows assessing, with sufficient reliability and directly in the field, the main feed nutritional quality parameters (moisture, crude protein, fiber, tannins, dry matter digestibility, etc.). Crude protein has been measured by NIRS in a number of forage grasses and legumes, annuals and perennials, cereal forage crops, diverse meadow, and native herbage. It has also been measured in a wide range of ensiled forages, feed ingredients (particularly grains) and formulated feeds for ruminants, pigs, and poultry. Crude protein calibrations are usually accurate and precise. Although plant fiber is heterogeneous, containing variable proportions of carbohydrates and small levels of protein, lignin, and minerals, NIRS calibrations for fiber can also be successfully derived. CIRAD and its Southern partners have created many calibrations on tropical pastures and forages using NIRS.
The rapid feedback of results to farmers and the low cost of feed analysis make NIRS portable devices particularly interesting, as a decision support tools, to improve the quality of the ruminant diet and the rational management of grasslands in real time. Timely decision making on the strategic use of nutritional supplements or on the adjustments in ration formulation to efficiently sustain milk, meat, or fiber production is also facilitated by this method.
Soil and organic matter analysis applications
A wide range of soil properties may be determined by using NIRS technique. The most significant opportunities provided by NIRS in soil analysis include its potential use in situ to determinate various biological, chemical, and physical properties using a single spectrum per sample. NIRS can easily predict nitrogen, carbon and organic matter contents as well as the cation exchange capacity in soils. Several studies have been conducted on the analysis of an array of parameters in solid manures and composts by NIRS. Solid manure can be analyzed for moisture, total nitrogen, ammonium-nitrogen, total carbon and crude ash. Compost from various animal and plant sources can be measured for pH, conductivity, moisture, nitrogen, ammonia, carbon, fibers, etc. NIRS can also be used to predict chemical changes and the transformation stage of organic matter (slurry, green manure) during the composting process. It can as well be used for monitoring the degradation of cellulose as a major component of plant residues in the soil.
The NIRS approach makes the management and use of natural resources more efficient by enabling quantification of various chemical constituents of feedstuffs and soils, and of some biological parameters such as nutritional value of feed resources. Because of NIRS virtues such as being accurate, fast, economic and environment friendly, it has a vital role in implementation of precision farming systems.
The authors
- Pierre Dardenne, Walloon Agricultural Research Centre, Gembloux, Belgium , p.dardenne@cra.wallonie.be
- Paulo Salgado, CIRAD, Antsirabe, Madagascar, paulo.salgado@cirad.fr